Field of Consumption
Date
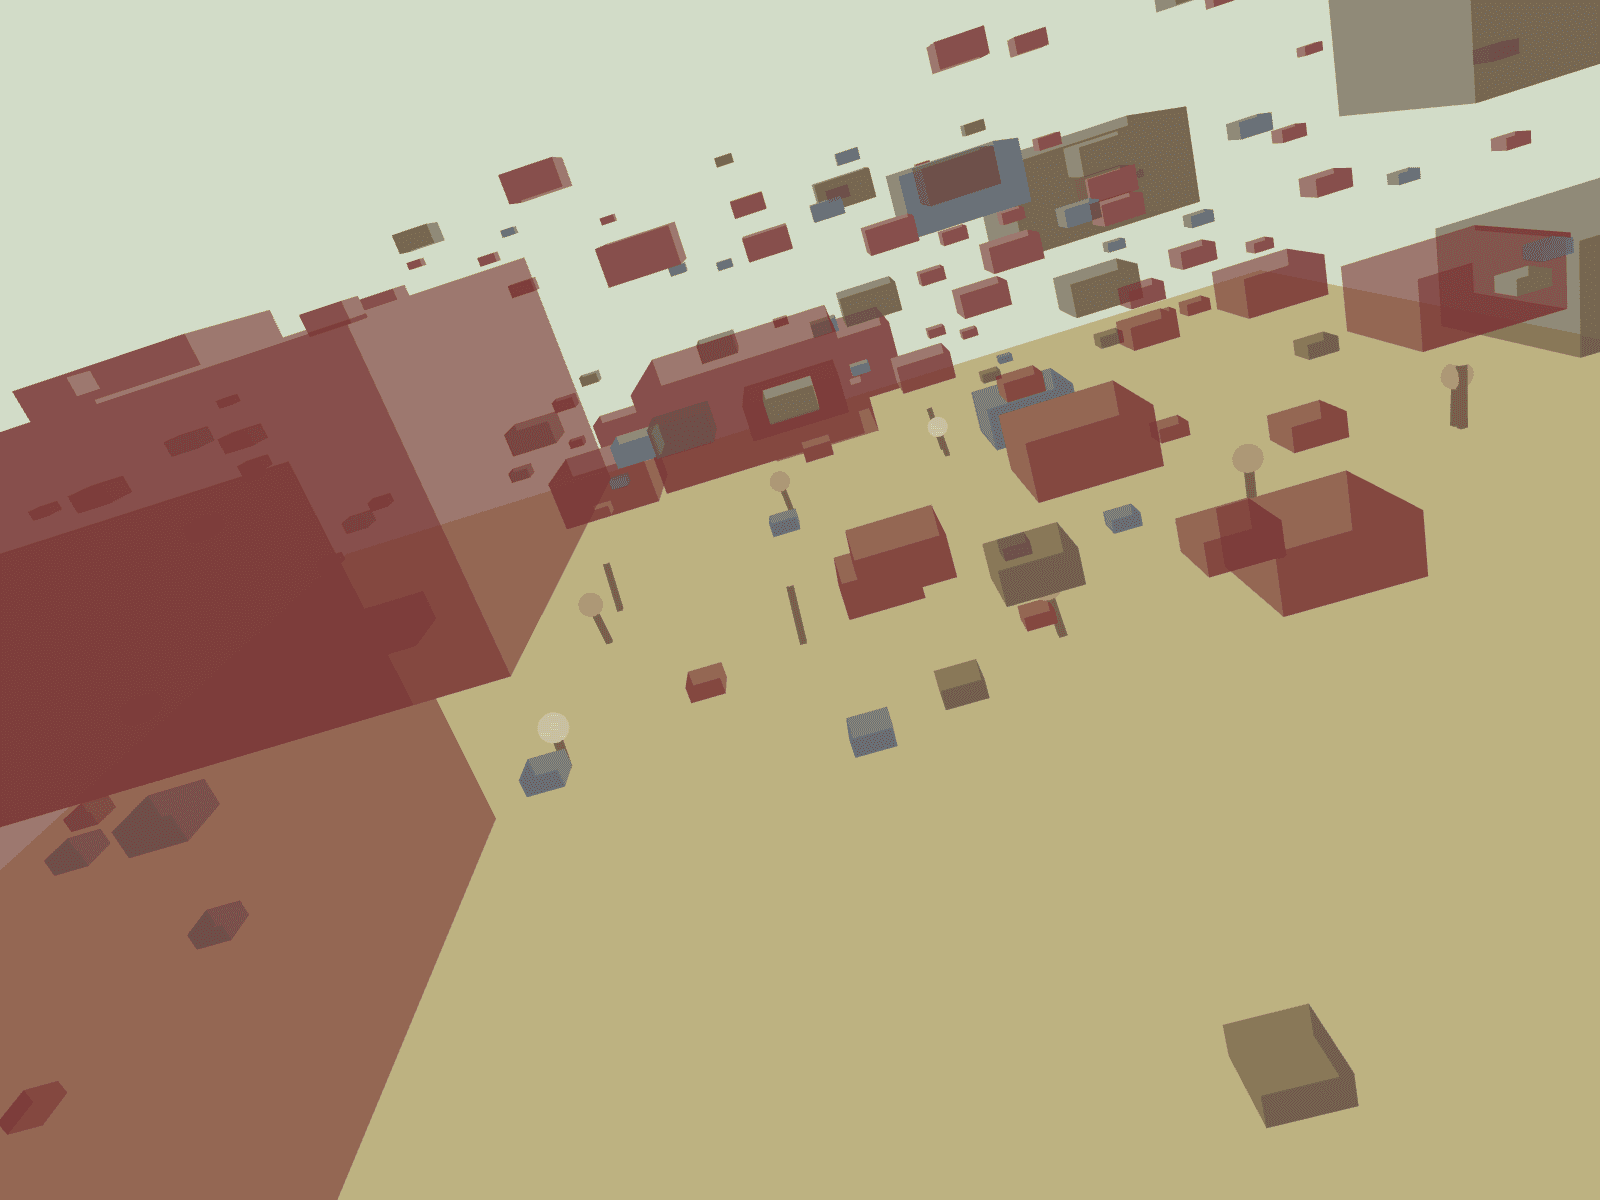
"Field of Consumption" visualizes the relationship between my daily grain intake and global food insecurity data. Built in p5.js using JavaScript, this work transforms datasets of my grain intake into a field of swaying stalks, each one scaled and colored according to the type and amount of grain I consumed. Above the field, global insecurity statistics appear as drifting block-like forms whose size corresponds to the severity of the dataset.
The visualization contrasts individual consumption with systemic pressure, creating a digital landscape that connects everyday behavior to global scarcity.